How Are Colors Measured?
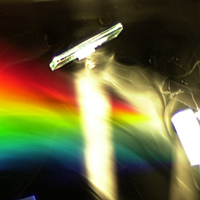
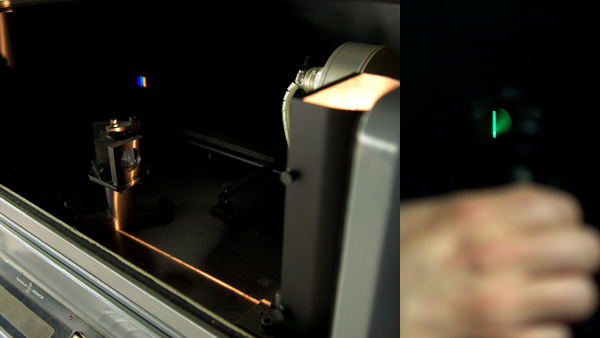
There is an entire scientific field called colorimetry, which means color measurement. The process of colorimetry mimics the process of human vision. Assuming we want to measure the color of a material that reflects light (like paint ... similar procedures are followed for measuring light sources or transmitting materials), the first step is to measure the object's spectral reflectance. This is the percentage of light of each wavelength that is reflected by the object and it is measured with an instrument called a spectrophotometer. We must then decide what light source to illuminate the object with for the measurements. This is done mathematically by selecting a standard spectral power distribution for the desired type of illumination (e.g. daylight, incandescent, fluorescent, etc.) and multiplying the energy in the light source by the percent of that energy reflected by the object wavelength by wavelength. This defines the stimulus energy that reaches our eyes. We then use standard visual response functions, known as color matching functions to figure out how much of that energy is absorbed by each of the three cone types. These numbers are called tristimulus values and define color matches. One standard set of tristimulus values are known as CIE XYZ.
XYZ tristimulus values define color matches, but they don't tell us what a color stimulus looks like. To do that, we need to account for adaptation to the viewing environment and the fact that the visual system responds nonlinearly to amounts of light (e.g., a light with twice as much energy as another does not appear twice as bright). Another set of mathematical equations define a color space known as CIELAB with dimensions that roughly correspond to perception. These dimensions are L* for lightness, a* for redness-greenness, and b* for yellowness-blueness. Alternatively, the CIELAB color space can be expressed in cylindrical coordinates with L* still for lightness, C* for chroma (related to colorfulness), and H for hue angle (red, yellow, green, blue, etc.)
The CIELAB color space is widely used around the world to define color materials and set tolerances for commerce. Most colored products that you can buy were evaluated in the CIELAB space to make sure they were produced in the proper color. However, some situations call for even more complicated mathematical models. For example sometimes the absolute amount of energy in a scene or the properties of the visual environment are important. In these cases, a type of model known as a color appearance model is used. CIECAM02 is one example of a recent, and widely adopted, color appearance model. In addition to predicting apparent lightness, chroma, and hue, it also has predictors of brightness, colorfulness, and saturation.
![]()
Explore the NEXT TOPIC at this level.
Explore the NEXT LEVEL on this topic.
Ever wonder ... Why is the sky blue?
Updated: Apr. 19, 2011